MetriVis
1.0
MetriVis is a server/client based application to visualize and
interactively explore very big XY graphs. It allows the user to mark
interesting parts in the graph on the graph and giving it a description that
can be shared with other people.
Exploring the graph is done in a way similar to Google Maps, instead of
a map a XY graph is displayed. It let's the user browse the graph by dragging or
using the arrow buttons. The graph supports X/Y independent zooming.
MetriVis is originally developed to visualize very large network metrices
(Netflow data). But it may be used to display any X/Y data. More
information on how to use MetriVis to solve your problems can be found in the
tutorial chapter.
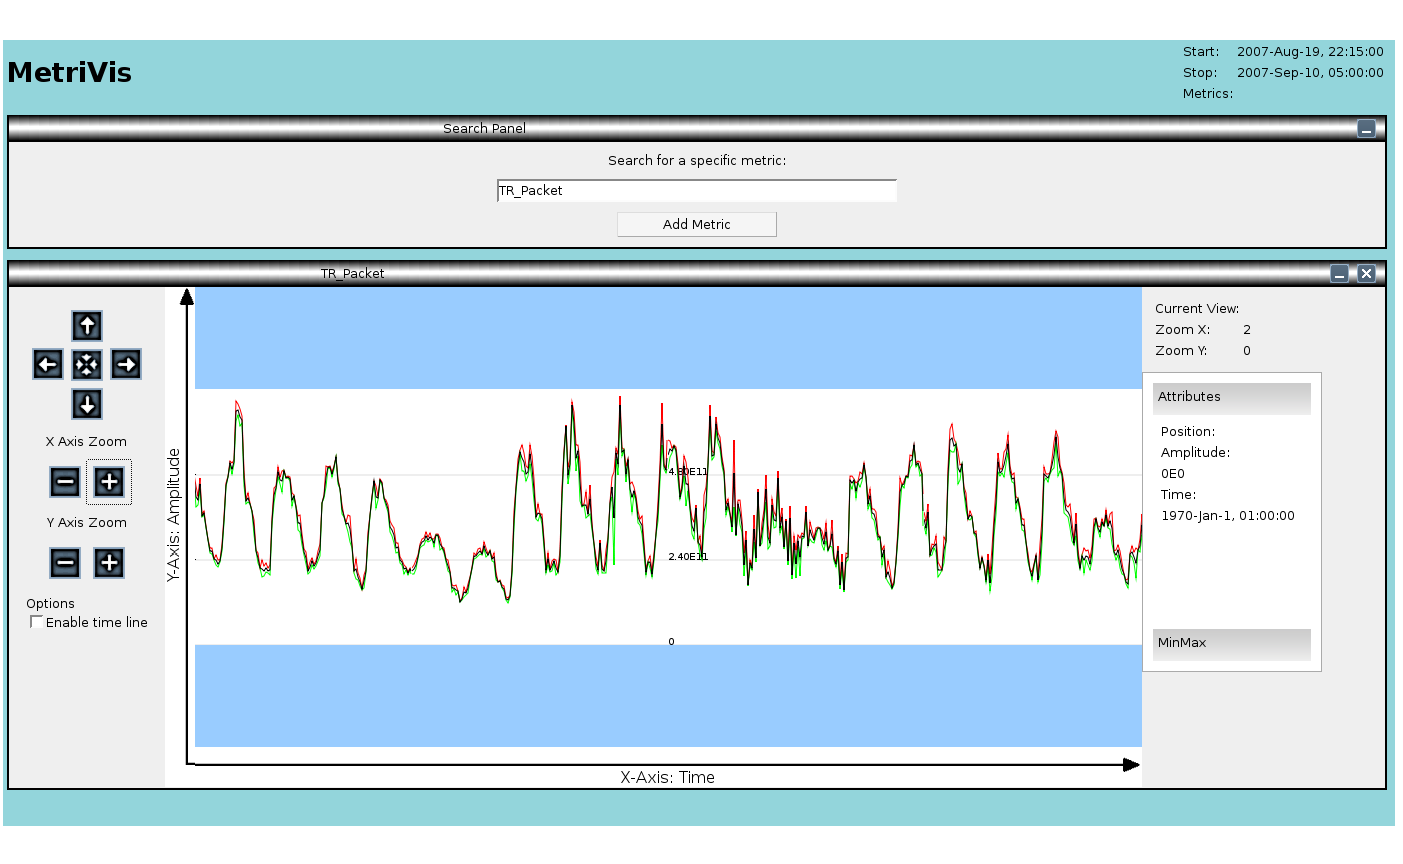
Screenshot, click to enlarge.
The application is designed to be fast and scalable, meaning that it copes well
with very big data sizes. For more informations about the design please take
a look at the design chapter. This chapter will
give you a high level introduction into the MetriVis framework. If you want to
dig into the source code you may want to take a look at the
Doxygen documentation. Or you may want
to take a look at the source code itself (eg. browsing it on Sourceforge).
Browse SVN Repository
Following people are participating in the development of MetriVis:
- Patrick Boenzli (main developer and maintainer), [boenzlip .at. gmail .dot. com]
- Dominik Schatzmann (maintainer)
- Bernhard Tellenbach
- Martin
- Philipp Henkel (thanks for the webpage template)
We appreciate your suggestions, and would love to know if you use MetriVis.
Hopefully you will enjoy it and find it useful. Please post questions, comments,
bugs, or contact me at:
threadpool@googlemail.com
or
www.sourceforge.net/projects/metrivis