| MetriVis | Overview | Download | User Manual | Development |
| Reference | Overview | Design Documentation | Reference Backend | Reference Frontend |
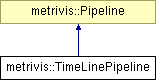
#include <TimeLinePipeline.h>
This pipeline is used to create XYPlots for the web-frontend. It contains PipelineProcesses needed to fetch the desired data, to reduce it's density with a simple LOD (Level Of Detail) algorithm and then to create the actual graph from it. This pipeline returns a string representing the tiled PNG image.
 1.5.3
1.5.3